File:Two carrier 3rd order intermod measurement.png
Jump to navigation
Jump to search
Size of this preview: 800 × 500 pixels. Other resolutions: 320 × 200 pixels | 640 × 400 pixels | 1,200 × 750 pixels.
Original file (1,200 × 750 pixels, file size: 1.47 MB, MIME type: image/png, looped, 29 frames, 5.8 s)
Note: Due to technical limitations, thumbnails of this file will not be animated.
Summary
| Description |
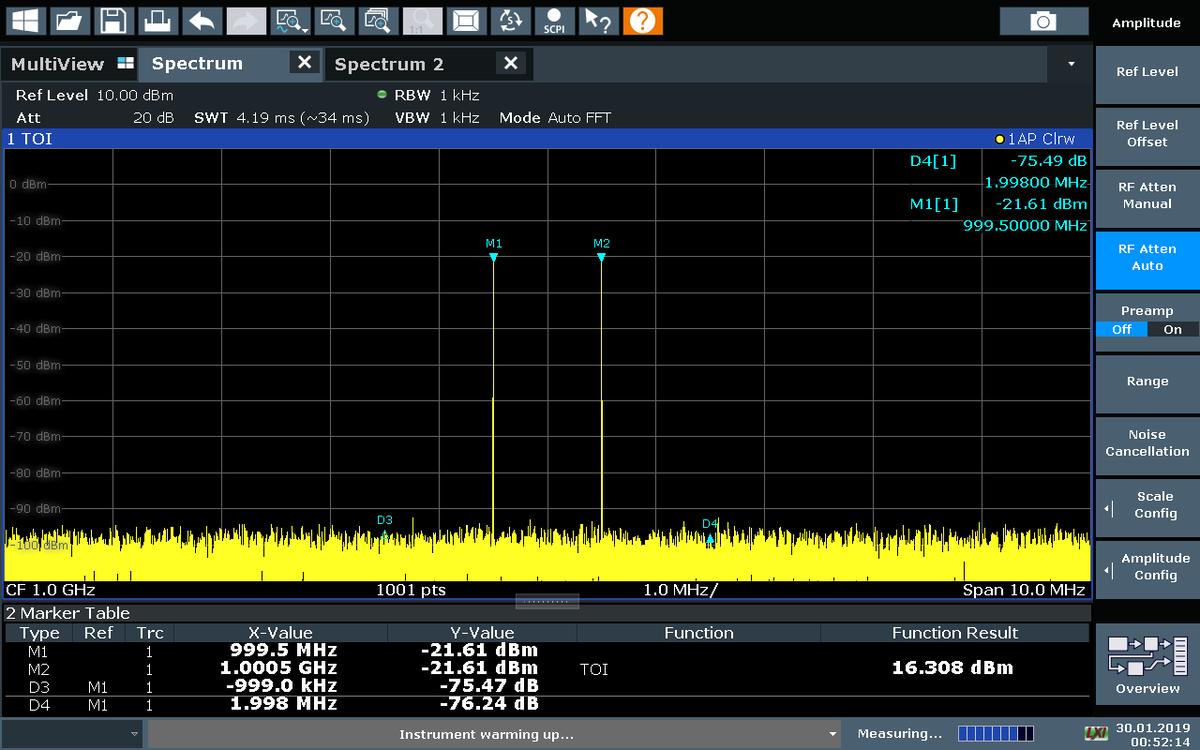
English: A non-linear amplifier was swept over a 29 dB power range in 1 dB increments with 2 carriers spaced 1 MHz apart (M1, M2).
The non-linear amplifier produces undesirable intermodulation products (D3, D4) at 2*f1-f2 (D3) and 2*f2-f1 (D4). Note that the 3rd order intermods grow by 3 dB for every 1 dB increase in input power, while the carriers increase by 1 dB for every 1 dB increase in input power. The spectrum becomes highly distorted at higher power levels as the odd order intermod products (3rd, 5th, 7th, 9th, ...) increase in level with respect to the carriers. An nth order intermod grows by n dB for every 1 dB increase in input power. I captured these screenshots from a Rohde & Schwarz FSW spectrum analyzer (non-free software) and created the animation myself. Usage of these screenshots constitutes fair use. |
| Date | |
| Source | I measured the intermodulation characteristics of an amplifier myself on a spectrum analyzer |
| Author | Ice Ardor |
Licensing
I, the copyright holder of this work, hereby publish it under the following licenses:

|
Permission is granted to copy, distribute and/or modify this document under the terms of the GNU Free Documentation License, Version 1.2 or any later version published by the Free Software Foundation; with no Invariant Sections, no Front-Cover Texts, and no Back-Cover Texts. A copy of the license is included in the section entitled GNU Free Documentation License. |
This file is licensed under the Creative Commons Attribution-Share Alike 4.0 International license.
- You are free:
- to share – to copy, distribute and transmit the work
- to remix – to adapt the work
- Under the following conditions:
- attribution – You must give appropriate credit, provide a link to the license, and indicate if changes were made. You may do so in any reasonable manner, but not in any way that suggests the licensor endorses you or your use.
- share alike – If you remix, transform, or build upon the material, you must distribute your contributions under the same or compatible license as the original.
You may select the license of your choice.
File history
Click on a date/time to view the file as it appeared at that time.
| Date/Time | Thumbnail | Dimensions | User | Comment | |
|---|---|---|---|---|---|
| current | 03:19, 30 January 2019 | | 1,200 × 750 (1.47 MB) | wikimediacommons>Ice Ardor | {{subst:Upload marker added by en.wp UW}} {{Information |Description = {{en|A non-linear amplifier was swept over a 29 dB power range in 1 dB increments with 2 carriers spaced 1 MHz apart (M1, M2). The non-linear amplifier produces undesirable intermodulation products (D3, D4) at 2*f1-f2 (D3) and 2*f2-f1 (D4). Note that the 3rd order intermods grow by 3 dB for every 1 dB increase in input power, while the carriers increase by 1 dB for every 1 dB increase in input power. The spectrum becomes... |
File usage
There are no pages that use this file.