File:Scalloping and noise floor comparisons (2 window functions).png
Jump to navigation
Jump to search
No higher resolution available.
Scalloping_and_noise_floor_comparisons_(2_window_functions).png (562 × 457 pixels, file size: 22 KB, MIME type: image/png)
Summary
| Description |
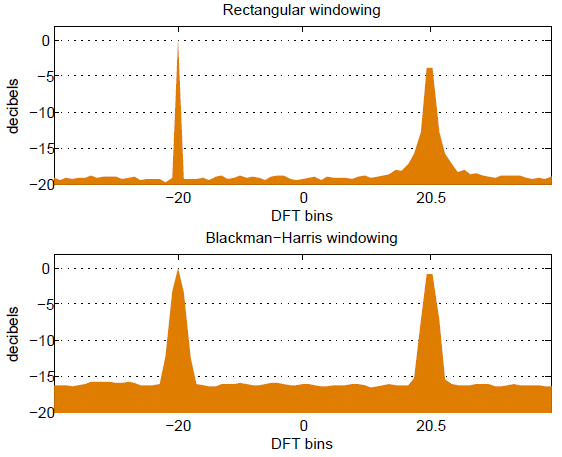
English: Comparison of two window functions in terms of their effects on equal-strength sinusoids with additive noise. The noise "floor" is smoothed by averaging many DFTs to reveal the substantial difference in levels, caused by the different window functions. The sinusoid at bin -20 suffers no scalloping and the one at bin +20.5 exhibits worst-case scalloping. The rectangular window produces the most scalloping but also narrower peaks and lower noise-floor. A third sinusoid with amplitude -16 dB would be noticeable in the upper spectrum, but not in the lower spectrum. |
|||
| Date | ||||
| Source | Own work | |||
| Author | Bob K | |||
| Permission (Reusing this file) |
I, the copyright holder of this work, hereby publish it under the following license:
|
|||
| Other versions |
Derivative works of this file:
|
|||
| Script | MatlabN = 256; % sams_per_fft;
window1 = rectwin(N)'/sum(rectwin(N));
window2 = blackmanharris(N)'/sum(blackmanharris(N));
%
Fs = N; % sams_per_sec;
HzPerBin = Fs/N;
F1 = -20.0*HzPerBin; % bin -20
F2 = +20.5*HzPerBin; % bin 20.5
%
L = 100000;
n = 1:L;
x = exp(j*2*pi*F1/Fs*n) + exp(j*2*pi*F2/Fs*n);
x = x + (randn(1,L) +j*randn(1,L))*1.4;
%
sams_per_offset = 0.75*N; % overlap = 25%
%
% number of samples available beyond just one FFT
excess_sams = length(x) - N;
%
j1 = floor( excess_sams / sams_per_offset );
sams_per_offset = floor( excess_sams / j1 );
num_ffts = 1 + j1;
%
% define the first block of data
samples = 1:N;
%
amplitude1 = zeros(1,N);
amplitude2 = zeros(1,N);
%
% Loop over all the available blocks
for j1 = 1 : num_ffts
amplitude1 = amplitude1 + abs(fft( x(samples) .* window1 ));
amplitude2 = amplitude2 + abs(fft( x(samples) .* window2 ));
samples = samples + sams_per_offset;
end
%
warning off MATLAB:log:logOfZero
amplitude1 = 20*log10(fftshift(amplitude1/num_ffts));
amplitude2 = 20*log10(fftshift(amplitude2/num_ffts));
%
abscissa = -40:40;
figure
subplot(2,1,1); h = area(abscissa, amplitude1(abscissa +N/2+1), ...
'FaceColor', [.871 .49 0], 'Linestyle', 'none')
set(h,'BaseValue',-20)
xlim([-40 40])
ylim([-20 2])
set(gca,'XTick', [-20 0 20.5])
set(gca,'YGrid','on')
xlabel('DFT bins')
ylabel('decibels')
title('Rectangular windowing');
%
subplot(2,1,2); h = area(abscissa, amplitude2(abscissa +N/2+1), ...
'FaceColor', [.871 .49 0], 'Linestyle', 'none')
set(h,'BaseValue',-20)
xlim([-40 40])
ylim([-20 2])
set(gca,'XTick', [-20 0 20.5])
set(gca,'YGrid','on')
xlabel('DFT bins')
ylabel('decibels')
title('Blackman-Harris windowing');
|


.png)
File history
Click on a date/time to view the file as it appeared at that time.
| Date/Time | Thumbnail | Dimensions | User | Comment | |
|---|---|---|---|---|---|
| current | 18:46, 19 December 2011 | | 562 × 457 (22 KB) | wikimediacommons>Bob K | Change graph format to area fill to highlight noise floor comparison. |
File usage
The following page uses this file:
.png)