File:MilankovitchCyclesOrbitandCores.png

|
This graph image could be re-created using vector graphics as an SVG file. This has several advantages; see Commons:Media for cleanup for more information. If an SVG form of this image is available, please upload it and afterwards replace this template with
{{vector version available|new image name}}.It is recommended to name the SVG file “MilankovitchCyclesOrbitandCores.svg”—then the template Vector version available (or Vva) does not need the new image name parameter. |
Summary
| Description |
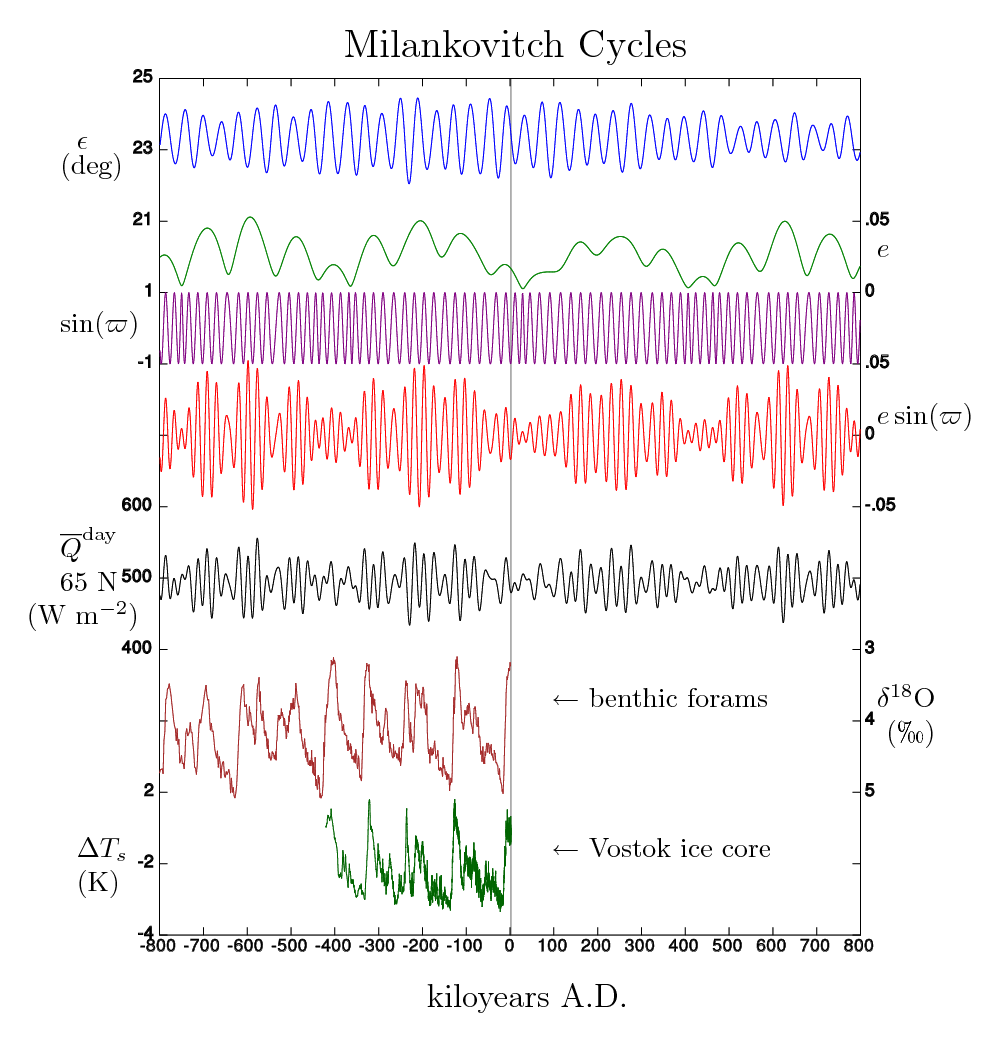
English: Orbital Parameters for the Earth:
http://aom.giss.nasa.gov/srorbpar.html Insolation calculation is generated from the orbital parameters Vostok ice core data:
Vostok Ice Core Data for 420,000 Years, IGBP PAGES/World Data Center for Paleoclimatology Data Contribution Series #2001-076. NOAA/NGDC Paleoclimatology Program, Boulder CO, USA. ftp://ftp.ncdc.noaa.gov/pub/data/paleo/icecore/antarctica/vostok/deutnat.txt Temperature reconstruction is offered within the dataset. Benthic foram data:
Pleistocene stack of 57 globally distributed benthic d18O records, Paleoceanography,20, PA1003, doi:10.1029/2004PA001071. http://lorraine-lisiecki.com/stack.html A definitive temperature reconstruction is not offered within the data set. But from: http://lorraine-lisiecki.com/thesis_appendix.html#2-Appendix-B-The-d18O-of-Foraminifera is the statement:
|
| Date | |
| Source | Own work |
| Author | Incredio |
| Other versions |
File:MilankovitchCyclesOrbitandCores.png File:MilankovitchCyclesOrbitandCoresRecaptioned.png, File:MilankovitchCyclesOrbitandCoresRecaptioned-sr.png File:Milankovic.jpg, File:Milankovic-sr.jpg |
Licensing
- You are free:
- to share – to copy, distribute and transmit the work
- to remix – to adapt the work
- Under the following conditions:
- attribution – You must give appropriate credit, provide a link to the license, and indicate if changes were made. You may do so in any reasonable manner, but not in any way that suggests the licensor endorses you or your use.
File history
Click on a date/time to view the file as it appeared at that time.
| Date/Time | Thumbnail | Dimensions | User | Comment | |
|---|---|---|---|---|---|
| current | 03:07, 20 February 2025 | | 3,000 × 3,133 (781 KB) | wikimediacommons>Incredio | Not SVG yet, but much higher resolution PNG |
File usage
The following 2 pages use this file: