File:Instrumental Temperature Record.png
Jump to navigation
Jump to search
Size of this preview: 770 × 600 pixels. Other resolutions: 308 × 240 pixels | 616 × 480 pixels | 1,000 × 779 pixels.
Original file (1,000 × 779 pixels, file size: 44 KB, MIME type: image/png)
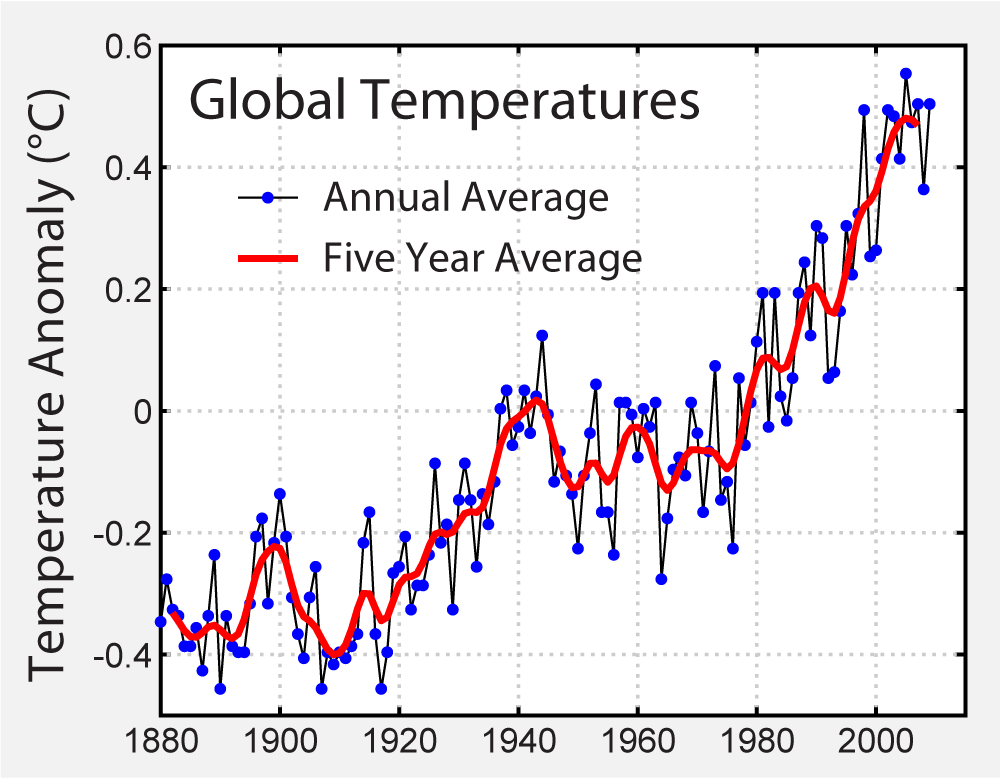
| Description | This image shows the instrumental record of global average w:temperatures as compiled by the w:NASA's w:Goddard Institute for Space Studies. (2006) "Global temperature change". Proc. Natl. Acad. Sci. 103: 14288-14293. Following the common practice of the w:IPCC, the zero on this figure is the mean temperature from 1961-1990. This figure was originally prepared by Robert A. Rohde from publicly available data and is incorporated into the Global Warming Art project. | |||
| Source | http://data.giss.nasa.gov/gistemp/graphs/ | |||
| Author | ||||
| Other versions |
Derivative works of this file:
|

.svg)
Image from Global Warming Art
This image is an original work created for Global Warming Art. Please refer to the image description page for more information.

|
Permission is granted to copy, distribute and/or modify this document under the terms of the GNU Free Documentation License, Version 1.2 or any later version published by the Free Software Foundation; with no Invariant Sections, no Front-Cover Texts, and no Back-Cover Texts. A copy of the license is included in the section entitled GNU Free Documentation License. |
| This file is licensed under the Creative Commons Attribution-Share Alike 3.0 Unported license. | ||
| ||
| This licensing tag was added to this file as part of the GFDL licensing update. |
| Dragons flight's Temperature Record Series |
| This figure is part of a series of plots created by Dragons flight to illustrate changes in Earth's temperature and climate across many different time scales. |
| Time Period: 25 yrs | 150 yrs | 1 kyr | 2 kyr | 12 kyr | 450 kyr | 5 Myr | 65 Myr | 500 Myr |
| For articles related to this topic see: Temperature record |
File history
Click on a date/time to view the file as it appeared at that time.
| Date/Time | Thumbnail | Dimensions | User | Comment | |
|---|---|---|---|---|---|
| current | 01:51, 20 February 2010 | | 1,000 × 779 (44 KB) | wikimediacommons>Dragons flight | update to 2009 |
File usage
The following page uses this file: