File:Gaussian 2d surface.png
Jump to navigation
Jump to search
Size of this preview: 800 × 422 pixels. Other resolutions: 320 × 169 pixels | 640 × 338 pixels | 1,024 × 540 pixels | 1,923 × 1,015 pixels.
Original file (1,923 × 1,015 pixels, file size: 215 KB, MIME type: image/png)
Summary
| Description |
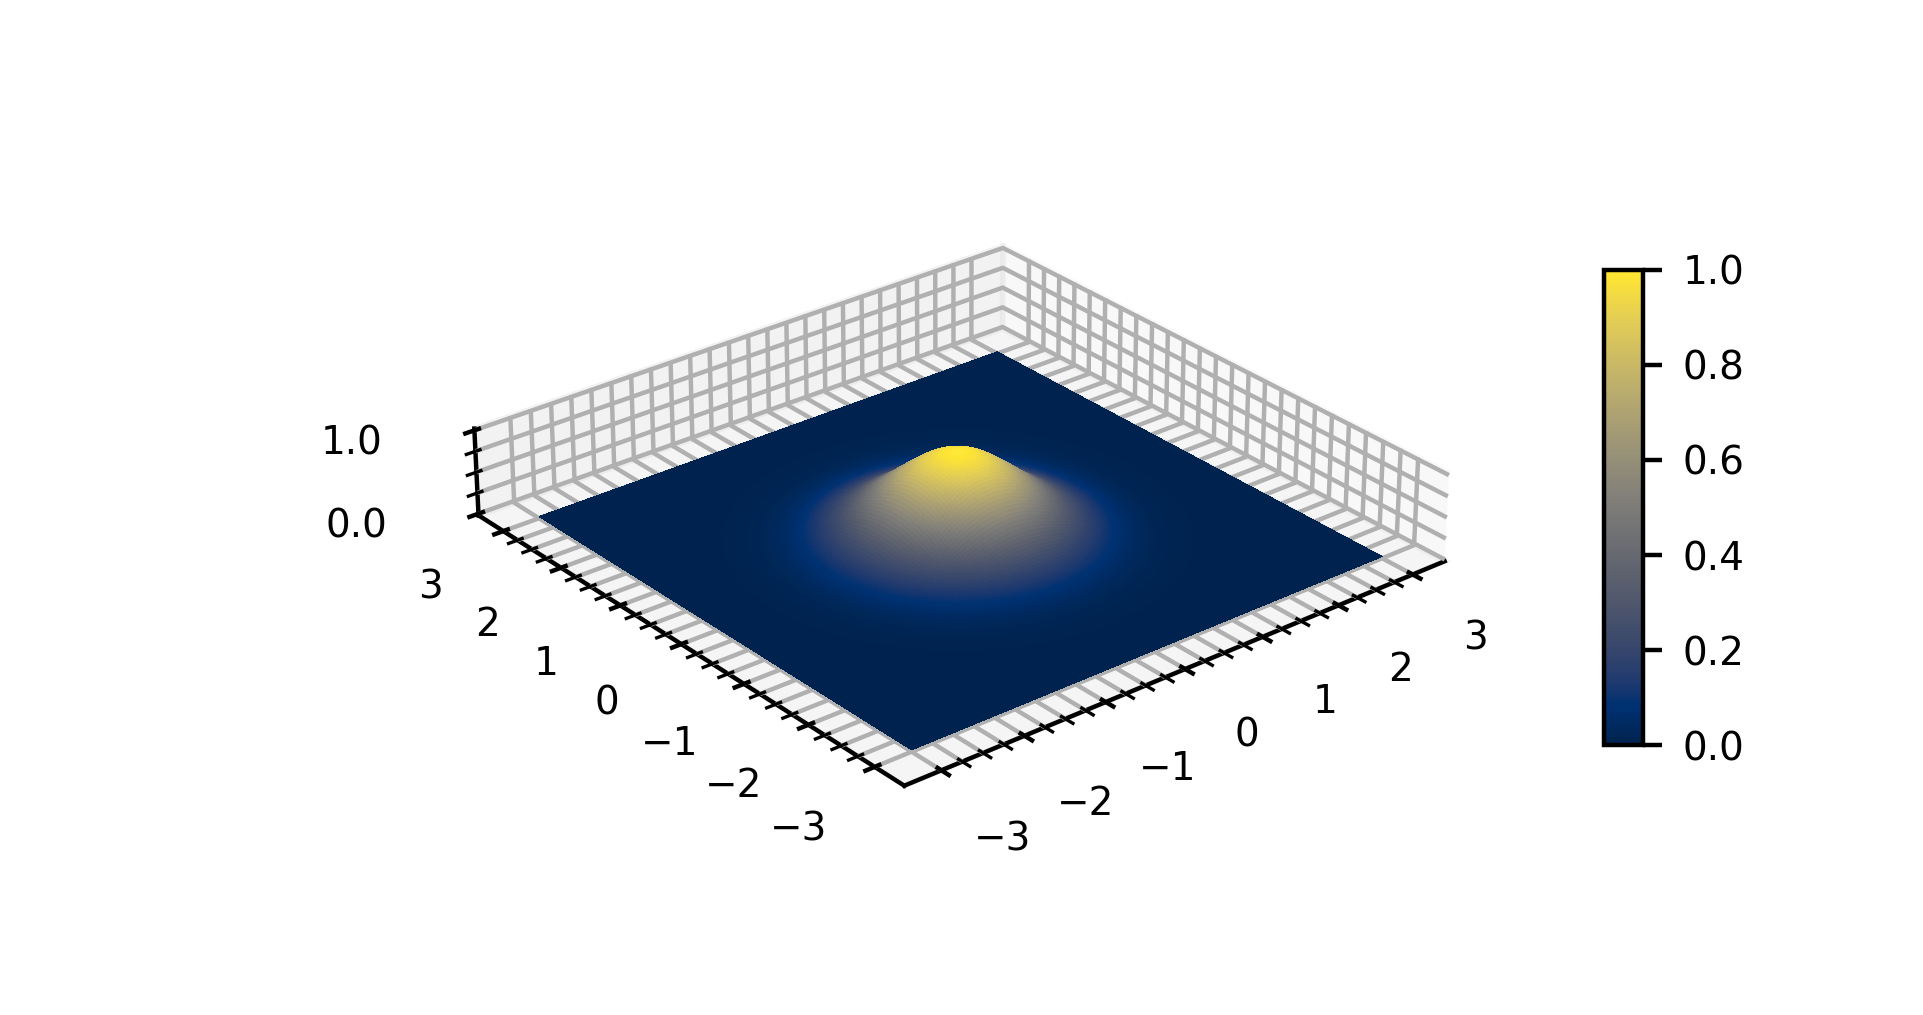
English: Created in Python with Numpy and Matplotlib. |
| Date | |
| Source | Own work |
| Author | Kopak999 |
| PNG development | |
| Source code | Python codeimport numpy as np
import matplotlib as mpl
import matplotlib.pyplot as plt
from matplotlib import cm
exp = np.exp
def Gaussian2D(X, Y, a=1,):
"""
This function takes meshgrids of X- and Y-values and outputs an array of
Z-values in the shape of the Gaussian distribution:
exp(-a(X^2 + Y^2)).
"""
return exp(-a*(X**2 + Y**2))
def plotGaussianSurface(
X, Y, Z,
colormap=cm.cividis,
title="",
filetype="png",
saveflag=False,
resolution=200,
dpi=300,
numticks_xy=7,
numticks_z=2,
numticks_xy_minor=25,
numticks_z_minor=5,
):
"""
Plots a 3D-surface of a 2D-Gaussian function.
X, Y: Meshgrids of x- and y-values for the Gaussian.
Z: The output of the Gaussian function.
colormap: The colormap for the surface, mapped to the Z-values of the
graph.
title: Title of the graph.
filetype: Three-letter extension of the image filetype for saving the
graph. Default is png.
saveflag: Boolean flag to check if the graph should be saved to a file.
Set to True if you want to save the graph to a file. Default is False.
resolution: Number of pixels to render along the x- and y-axes.
Default is 200, which gives a 200x200 grid.
dpi: Dots-per-inch of the image. Default is 300.
"""
plt.ioff()
# Set up kwargs:
limit = int(np.ceil(np.amax(X)))
zmin = int(np.floor(np.amin(Z)))
zmax = int(np.ceil(np.amax(Z)))
norm = mpl.colors.Normalize(vmin=zmin, vmax=zmax)
aspect = (limit*2 + 1, limit*2 + 1, zmax)
xy_major_params = dict(
direction = "in",
)
xy_minor_params = dict(
direction = "in",
which = "minor",
)
xy_major_ticks = dict(
ticks = np.linspace(-limit, limit, numticks_xy, endpoint=True,),
)
xy_minor_ticks = dict(
ticks = np.linspace(-limit, limit, numticks_xy_minor, endpoint=True,),
minor = True,
)
z_major_params = dict(
which = "major",
labelbottom = True,
labeltop = False,
)
z_minor_params = dict(
which = "minor",
)
z_major_ticks = dict(
ticks = np.linspace(0, zmax, numticks_z, endpoint=True,),
)
z_minor_ticks = dict(
ticks = np.linspace(0, zmax, numticks_z_minor, endpoint=True,),
minor = True,
)
tick_labelsize = 7
fig = plt.figure(dpi=dpi)
ax = fig.add_subplot(1, 1, 1, projection ='3d')
# Plot the surface
surf = ax.plot_surface(
X, Y, Z,
cmap = colormap,
linewidth=0,
antialiased=False,
vmin = zmin, vmax = zmax,
rcount = resolution,
ccount = resolution,
norm = norm,
)
# Customize the z axis.
ax.set_zlim(zmin, zmax)
# ax.zaxis.set_major_locator(LinearLocator(10))
ax.zaxis.set_major_formatter('{x:.1f}')
ax.set_title(
title,
fontdict = dict(verticalalignment = "bottom"),
)
ax.set_box_aspect(aspect)
# ax.proj_type("ortho")
ax.set_facecolor('none')
# Set tick parameters
ax.xaxis.set_tick_params(**xy_major_params)
ax.xaxis.set_tick_params(**xy_minor_params)
ax.yaxis.set_tick_params(**xy_major_params)
ax.yaxis.set_tick_params(**xy_minor_params)
ax.zaxis.set_tick_params(**z_major_params)
ax.zaxis.set_tick_params(**z_minor_params)
ax.set_xticks(**xy_major_ticks)
ax.set_xticks(**xy_minor_ticks)
ax.set_yticks(**xy_major_ticks)
ax.set_yticks(**xy_minor_ticks)
ax.set_zticks(**z_major_ticks)
ax.set_zticks(**z_minor_ticks)
ax.tick_params(labelsize=tick_labelsize)
cbar = fig.colorbar(
surf,
ax=ax,
orientation='vertical',
shrink=0.5,
aspect=12,
pad = 0.10,
)
cbar.ax.tick_params(labelsize=tick_labelsize)
if saveflag:
savePlot(colormap, filetype)
plt.tight_layout()
plt.show()
x = y = np.linspace(-3, 3, 2**10, endpoint=True)
X, Y = np.meshgrid(x, y)
plotargs = dict(
saveflag = False,
dpi = 400,
resolution = 200,
numticks_xy=7,
numticks_xy_minor=25,
numticks_z=2,
numticks_z_minor=5,
)
plotGaussianSurface(X, Y, Gaussian2D(X, Y), **plotargs,)
|
Licensing
I, the copyright holder of this work, hereby publish it under the following license:
This file is licensed under the Creative Commons Attribution-Share Alike 4.0 International license.
- You are free:
- to share – to copy, distribute and transmit the work
- to remix – to adapt the work
- Under the following conditions:
- attribution – You must give appropriate credit, provide a link to the license, and indicate if changes were made. You may do so in any reasonable manner, but not in any way that suggests the licensor endorses you or your use.
- share alike – If you remix, transform, or build upon the material, you must distribute your contributions under the same or compatible license as the original.
File history
Click on a date/time to view the file as it appeared at that time.
| Date/Time | Thumbnail | Dimensions | User | Comment | |
|---|---|---|---|---|---|
| current | 02:30, 17 December 2020 | | 1,923 × 1,015 (215 KB) | wikimediacommons>Kopak999 | Uploaded own work with UploadWizard |
File usage
The following page uses this file: