File:Amoeba3.png
Jump to navigation
Jump to search
Size of this preview: 755 × 599 pixels. Other resolutions: 302 × 240 pixels | 605 × 480 pixels | 967 × 768 pixels | 1,267 × 1,006 pixels.
Original file (1,267 × 1,006 pixels, file size: 12 KB, MIME type: image/png)
Summary
| Description |
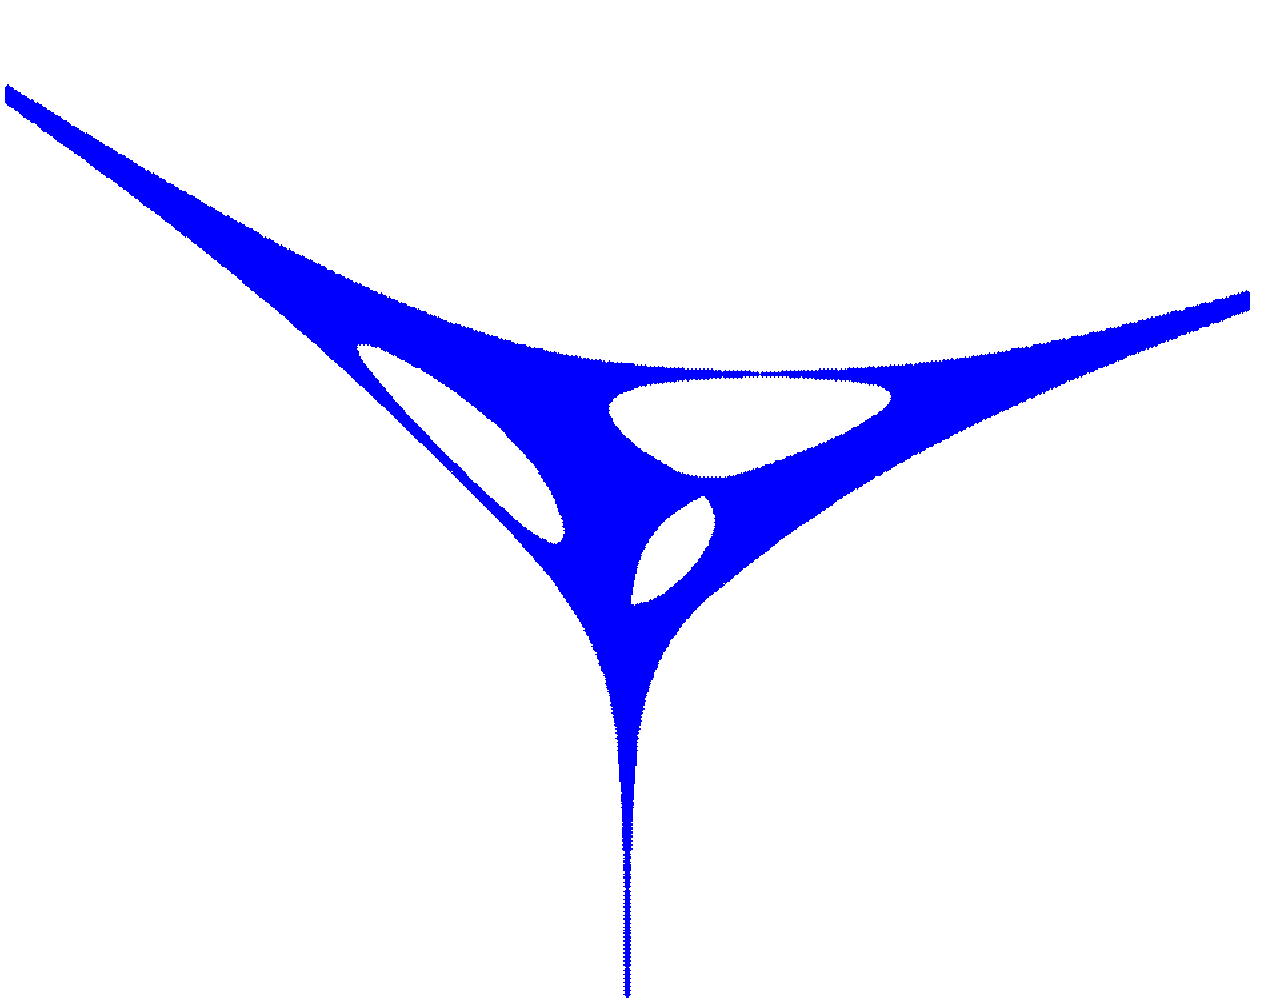
English: The amoeba of |
|||
| Date | ||||
| Source | Own work | |||
| Author | Oleg Alexandrov | |||
| Other versions |
|


Licensing
| This work has been released into the public domain by its author, Oleg Alexandrov. This applies worldwide. In some countries this may not be legally possible; if so: Oleg Alexandrov grants anyone the right to use this work for any purpose, without any conditions, unless such conditions are required by law. |
Source code
This media was created with MATLAB (numerical computing environment)
Here is a listing of the source used to create this file.
Here is a listing of the source used to create this file.
% find the amoeba of a polynomial, see
% http://en.wikipedia.org/wiki/Amoeba_%28mathematics%29

% consider a polynomial in z and w
%f[z_, w_] = 1 + z + z^2 + z^3 + z^2*w^3 + 10*z*w + 12*z^2*w + 10*z^2*w^2

% as a polynomial in w with coeffs polynonials in z, its coeffs are
% [z^2, 10*z^2, 12*z^2+10*z, 1 + z + z^2 + z^3] (from largest to smallest)

% as a polynomial in z with coeffs polynonials in w, its coeffs are
% [1, 1+w^3+12*w+10*w^2, 1+10*w, 1] (from largest to smallest)

function main()

   figure(3); clf; hold on;
   axis([-10, 10, -6, 7]); axis equal; axis off;
   fs = 20; set(gca, 'fontsize', fs);

   ii=sqrt(-1);
   tiny = 100*eps;

   Ntheta = 300;
   NR=      400; NRs=100; % NRs << NR

   % LogR is a vector of numbers, not uniformly distributed (more points where needed).
   A=-10; B=10; AA = -0.1; BB = 0.1;
   LogR  = [linspace(A, B, NR-NRs), linspace(AA, BB, NRs)]; LogR = sort (LogR);
   R     = exp(LogR);

   % a vector of angles
   Theta = linspace(0, 2*pi, Ntheta);

   Rho = zeros(1, 3*Ntheta); % will store the absolute values of the roots
   One = ones (1, 3*Ntheta);

   % draw the 2D figure as union of horizontal pieces and then union of vertical pieces
   for type=1:2

	  for count_r = 1:NR
		 count_r

		 r = R(count_r);
		 for count_t =1:Ntheta

			theta = Theta (count_t);

			if type == 1
			   z=r*exp(ii*theta);
			   Coeffs = [z^2, 10*z^2, 12*z^2+10*z, 1 + z + z^2 + z^3];
			else
			   w=r*exp(ii*theta);
			   Coeffs = [1, 1+w^3+12*w+10*w^2, 1+10*w, 1];
			end

			% find the roots of the polynomial with given coefficients
			Roots = roots(Coeffs);

                        % log |root|. Use max() to avoid log 0.
			Rho((3*count_t-2):(3*count_t))= log (max(abs(Roots), tiny));
		 end


		 % plot the roots horizontally or vertically
		 if type == 1
			plot(LogR(count_r)*One, Rho, 'b.');
		 else
			plot(Rho, LogR(count_r)*One, 'b.');
		 end

	  end

   end

   saveas(gcf, 'amoeba3.eps', 'psc2');

% A function I decided not to use, but which may be helpful in the future.
%function find_gaps_add_to_curves(count_r, Rho)
%
%   global Curves;
%
%   Rho = sort (Rho);
%   k = length (Rho);
%
%   av_gap = sum(Rho(2:k) - Rho (1:(k-1)))/(k-1);
%
%   % top-most and bottom-most curve
%   Curves(1, count_r)=Rho(1); Curves(2, count_r)=Rho(k);
%
%   % find the gaps, which will give us points on the curves limiting the amoeba
%   count = 3;
%   for j=1:(k-1)
%	  if Rho(j+1) - Rho (j) > 200*av_gap
%
%		 Curves(count, count_r) = Rho(j);   count = count+1;
%		 Curves(count, count_r) = Rho(j+1); count = count+1;
%	  end
%   end

% The polynomial in wiki notation
%<math>P(z_1, z_2)=1 + z_1\,</math>
%<math>+ z_1^2 + z_1^3 + z_1^2z_2^3\,</math>
%<math>+ 10z_1z_2 + 12z_1^2z_2\,</math>
%<math>+ 10z_1^2z_2^2.\,</math>
File history
Click on a date/time to view the file as it appeared at that time.
| Date/Time | Thumbnail | Dimensions | User | Comment | |
|---|---|---|---|---|---|
| current | 16:45, 2 March 2007 | | 1,267 × 1,006 (12 KB) | wikimediacommons>Oleg Alexandrov | Made by myself with Matlab. |
File usage
There are no pages that use this file.