Matter power spectrum: Difference between revisions
imported>Sunlitsky No edit summary |
(No difference)
|
Latest revision as of 13:59, 14 April 2024
Template:More citations needed Template:Cosmology
The matter power spectrum describes the density contrast of the universe (the difference between the local density and the mean density) as a function of scale. It is the Fourier transform of the matter correlation function. On large scales, gravity competes with cosmic expansion, and structures grow according to linear theory. In this regime, the density contrast field is Gaussian, Fourier modes evolve independently, and the power spectrum is sufficient to completely describe the density field. On small scales, gravitational collapse is non-linear, and can only be computed accurately using N-body simulations. Higher-order statistics are necessary to describe the full field at small scales.
Definition
Let represent the matter overdensity, a dimensionless quantity defined as: where is the average matter density over all space.
The power spectrum is most commonly understood as the Fourier transform of the autocorrelation function, , mathematically defined as: for . This then determines the easily derived relationship to the power spectrum, , that is
Equivalently, letting denote the Fourier transform of the overdensity , the power spectrum is given by the following average over Fourier space:[1]
(note that is not an overdensity but the Dirac delta function).
Since has dimensions of (length)3, the power spectrum is also sometimes given in terms of the dimensionless function:[1]
Development according to gravitational expansion
If the autocorrelation function describes the probability of a galaxy at a distance from another galaxy, the matter power spectrum decomposes this probability into characteristic lengths, , and its amplitude describes the degree to which each characteristic length contributes to the total over-probability.
The overall shape of the matter power spectrum is best understood in terms of the linear perturbation theory analysis of the growth of structure, which predicts to first order that the power spectrum grows according to:
Where is the linear growth factor in the density, that is to first order , and is commonly referred to as the primordial matter power spectrum. Determining the primordial is a question that relates to the physics of inflation.
The simplest is the Harrison–Zeldovich spectrum (named after Edward R. Harrison and Yakov Zeldovich),[2][3] which characterizes according to a power law, . More advanced primordial spectra include the use of a transfer function which mediates the transition from the universe being radiation dominated to being matter dominated.
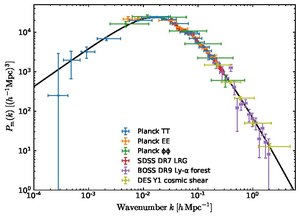
The broad shape of the matter power spectrum is determined by the growth of large-scale structure, with the turnover (the point where the spectrum goes from increasing with k to decreasing with k) at , corresponding to (where h is the dimensionless Hubble constant).[4] The co-moving wavenumber corresponding to the maximum power in the mass power spectrum is determined by the size of the cosmic particle horizon at the time of matter-radiation equality, and therefore depends on the mean density of matter and to a lesser extent on the number of neutrino families (), , for . The at smaller k (equivalently, larger scales) corresponds to scales which were larger than the particle horizon at the time of the transition from the regime of radiation dominance to that of matter dominance.[5][6] At linear order in perturbations , the power spectrum's broad shape follows
where is the scalar spectral index.[7]